India, in Infographics: Energy & Geopolitics
India Is Dodging The Energy Inflation That Hit The World’s Pumps
Retail Petrol In 19 Of The Top-20 Economies, Indexed To 100 At The Eve Of The War (Late Feb 2026), Across The 2026 Iran War Oil Shock (Brent $61 → $118). Each Line Is A Country’s Local-Currency Pump Price In Its Own Colour, With India In Saffron. Hover To Trace One, Or Use The Chips To Group The Lines By Policy — Full Pass-Through, Managed, Or State-Set. The Same Shock, 19 Very Different Outcomes.
Lines Are National-Average Retail Petrol, Local Currency, Indexed To 100 At The Eve Of The War (Late Feb 2026). Two Points Are Firm — That Base And The Current Pump (Sept 2026, From GlobalPetrolPrices’ Since-War Tracker); The Points Between Trace The Brent Timeline And Are Indicative. Colour Marks Policy: Full Pass-Through, Managed, Or State-Set. Turkey Excluded (Lira Distortion). Japan Spiked To A Record Mid-War, Then A Subsidy Clawed It Back To About +10%. Hover A Line For Its Actual Pump Prices.
India, Dodged It
+7%
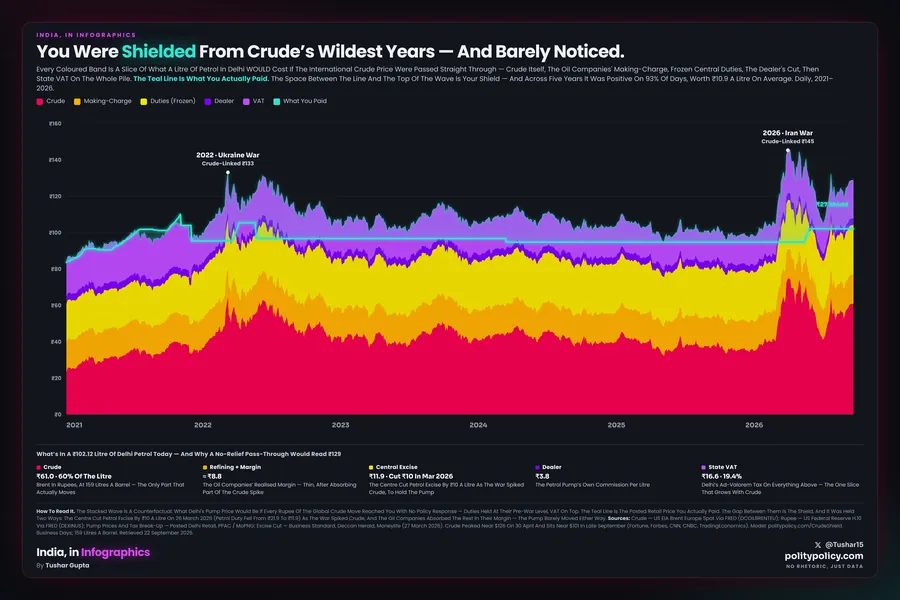
A March Excise And Import-Duty Cut, Plus State Oil Firms Absorbing Losses, Held India’s National Pump To +7% While The Hardest-Hit Paid Up To 42% More. Same Barrel, A Very Different Bill.
The Policy Gap
34 Pts
The US Pump Rose 42%, India’s Just 7% — A 34-Point Gap That Opened Not On The Oil Market But On Tax And Subsidy Desks.
The US, Hit Hardest
+42%
American Petrol Rose About 42% — The Steepest Of Any Big Economy — As The Crude Spike Passed Straight To The Pump. Germany Was Close Behind, At A National Record.
Japan, Subsidy-Capped
+10%
Japan Spiked To A Record ~¥190 Mid-War, Then A Government Subsidy Clawed The Pump Back To About +10% — Roughly A Third Of What Full Pass-Through Would Have Cost.
What The Chart Says
A Barrel Of Oil Is Global; A Litre Of Petrol Is Political. The 2026 Iran War Sent Brent From $61 To $118 In A Matter Of Weeks, And Every Economy Bought From The Same Spiking Market. Yet An American Driver Paid About 42% More By September, And A German One Hit A National Record, While An Indian Driver Paid Just 7% More, A Brazilian 4%, And A Japanese One — Behind A State Subsidy — About 10%. Nothing About The Oil Explains That Gap. It Is Tax Cuts, Fuel Subsidies, State-Set Prices And Public Oil Companies — The Choices Governments Make About Who Absorbs A Shock. The Pump Is Where The World Price Meets National Politics, And In 2026 The Politics Won By A Factor Of Six. All Figures Are The Change Since The Eve Of The War.
How This Was Built
The Prices
National-Average Retail Petrol In Local Currency, One Grade Per Country, Indexed To 100 At The Eve Of The War — The Last Pre-War Reading, About 23 February 2026. Two Firm, Sourced Points Anchor Each Line: That Base And The Current Pump (September 2026), Whose Change Comes From GlobalPetrolPrices.com’s “Since The War In Iran” Tracker, Cross-Checked Against National Reporting. The Points Between Trace The Crude Timeline And Are Indicative. Turkey Is Excluded — Its +51% Is Lira Depreciation, Not Fuel.
The Oil Shock
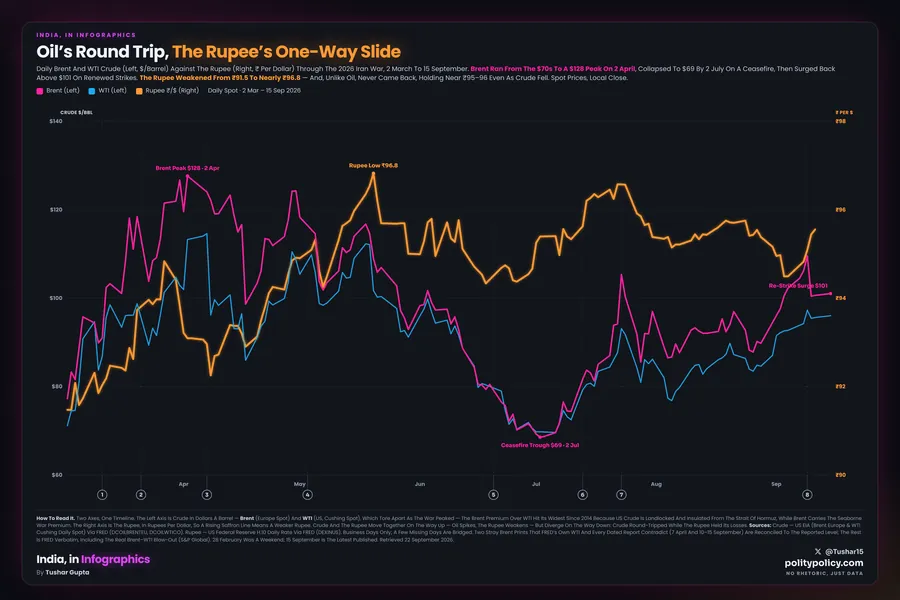
Brent Crude Ran From ~$61 In February 2026 To ~$118 By Late March As The Iran War Closed In On The Strait Of Hormuz, Fell To ~$70 On An April Ceasefire, Then Surged To ~$109 By September (CNBC Reported Brent At Its Highest Since May). Timeline From Gulf News And CNBC. The March Peak Is Annotated, Not Plotted Per Country.
Sources: GlobalPetrolPrices.com (Since-War Tracker, National-Average Retail Petrol, Local Currency) And US EIA For Prices; CNBC, Business Standard & Al Jazeera (India’s March Duty Cut); The Local & Yahoo Finance (Germany’s Record); Japan Today (Japan’s Subsidy); Gulf News & CNBC (The Brent Timeline). Retrieved 19 September 2026.