India, in Infographics: Trade

India’s Trade, Month By Month: Exports Versus Imports

Thirty-Six Months Of India’s Trade, September 2023 To August 2026 — Each Month, Two Stacked Bars: Exports (Merchandise In Red, Services In Yellow) And Imports (Merchandise In Blue, Services In Green). The Figure Above Each Bar Is Its Merchandise Year-On-Year Growth; Hover For All Four Series.

August 2026 Was The Strongest Export Month In These Three Years — $82.7bn Of Goods And Services Shipped Out, Up 25% On A Year Earlier, With Merchandise Exports Jumping 26% And Services 25%. Across March–August 2026, India Exported $479bn, Up 13% Year-On-Year — Momentum That Held Through A Turbulent Run Of Tariffs And Soft Global Demand.
$82.7bn
Total Exports, Aug 2026
+25% YoY — A Three-Year High
$479bn
Exports, Mar–Aug 2026
+13% Over The Same Six Months Of 2025
$17.5bn
Services Surplus, Aug 2026
Offsets Most Of The Goods Gap
$26.9bn
Goods Trade Deficit, Aug 2026
Crude Oil, Electronics And Gold
Merch ExportsServices ExportsMerch ImportsServices ImportsOverall Trade Deficit
$0bn$25bn$50bn$75bn$100bn9/2310/2311/2312/231/242/243/244/245/246/247/248/249/2410/2411/2412/241/252/253/254/255/256/257/258/259/2510/2511/2512/251/262/263/264/265/266/267/268/26Trade Deficit, $bn ▶0102030$6bn$2bn$9bn$4bn$14bnBalanced$9bn
India’s Top 20 Merchandise Export CategoriesUS$ Billion · HS Commodity Chapters · May–July 2026
The Three Most Recently Finalised Months Of DGCI&S Customs Data, Ranked By July 2026. % Is July Year-On-Year Growth. Source: DGCI&S Monthly Export-Import Data Bank.
#CategoryMayJunJulJul YoY
1Petroleum & Mineral FuelsHS 278.324.777.21+62.0%
2Electronics & ElectricalsHS 855.665.446.33+46.6%
3Machinery & Mechanical AppliancesHS 843.333.494.05+24.4%
4Vehicles & Auto PartsHS 872.412.322.46+12.6%
5Gems, Jewellery & Precious StonesHS 712.552.422.34-2.6%
6PharmaceuticalsHS 302.082.232.14-0.8%
7Organic ChemicalsHS 291.921.961.94+17.0%
8Iron & SteelHS 720.971.111.27+58.4%
9Articles Of Iron & SteelHS 730.840.860.95-5.4%
10Cereals (Rice & Wheat)HS 101.121.080.89-5.5%
11Plastics & ArticlesHS 390.860.800.80+12.0%
12Aluminium & ArticlesHS 760.800.820.77+42.2%
13Miscellaneous ChemicalsHS 380.640.670.69+2.5%
14Apparel & Clothing (Knitted)HS 610.630.580.66-9.4%
15Apparel & Clothing (Woven)HS 620.670.580.62+1.5%
16Optical, Medical & Precision InstrumentsHS 900.550.530.61+24.7%
17Meat & Edible OffalHS 020.550.500.60+49.0%
18CottonHS 520.520.530.58+19.3%
19Made-Up TextilesHS 630.500.520.57-0.7%
20Fish & SeafoodHS 030.560.580.57+2.9%

Two Stacked Bars Per Month — Exports (Merchandise + Services) And Imports (Merchandise + Services), US$ Billion, September 2023 To August 2026. Hover Any Month For All Four Series And Their Year-On-Year Growth. Merchandise: DGCI&S Customs. Services: RBI (Receipts / Payments). Latest Two Months Provisional; August 2026 Services Is A Commerce Estimate.

Merch Exports, Aug 2026
$43.8bn
Up 26% Year-On-Year — The Red Base Of Each Export Bar.
Services Exports, Aug 2026
$38.9bn
Now Nearly As Large As Goods Exports — And Growing Faster.
Merch Imports, Aug 2026
$70.7bn
The Blue Base Of Each Import Bar — India’s Largest Flow.
Services Imports, Aug 2026
$21.4bn
The Smallest Of The Four — Leaving A Wide Services Surplus.
What The Numbers Say
Two Bars, One Story. Read Left To Right, The Export Bars (Red + Yellow) Have Climbed Steadily, With Services (Yellow) Swelling Into Almost Half The Stack — India Now Sells The World Nearly As Much In Software, Business And Travel Services As In Goods. The Import Bars (Blue + Green) Stay Taller, Held Up By A Large Merchandise Bill (Crude Oil, Electronics, Gold). The Gap Between The Two Bars Each Month Is India’s Overall Trade Deficit — Wide On Goods, Cushioned By The Services Surplus. The YoY Figures Above The Bars Show Where The Momentum Is: Services Exports And, Lately, A Surge In Both Goods Flows.
Download The Graphic Post It How This Was Built ↓
Free To Use Anywhere With Credit To politypolicy.com

How This Was Built

Merchandise
DGCI&S Customs Monthly Exports And Imports, US$ Billion, As Released By The Department Of Commerce (PIB Monthly Foreign-Trade Statements). Figures Are Provisional For The Latest Two Months And Revised In Later Releases.
Services
RBI’s Monthly Data On India’s International Trade In Services (Receipts = Exports, Payments = Imports). Provisional And Revised With The Quarterly Balance Of Payments; The Monthly Values Sum To The RBI Quarterly Totals. August 2026 Services Are A Commerce Estimate, As RBI’s August Figure Was Not Yet Published.

Sources: DGCI&S / Department Of Commerce Monthly Foreign-Trade Statements (Merchandise); RBI Monthly Data On India’s International Trade In Services And Balance Of Payments (Services). Retrieved 16 September 2026.
Related Graphics

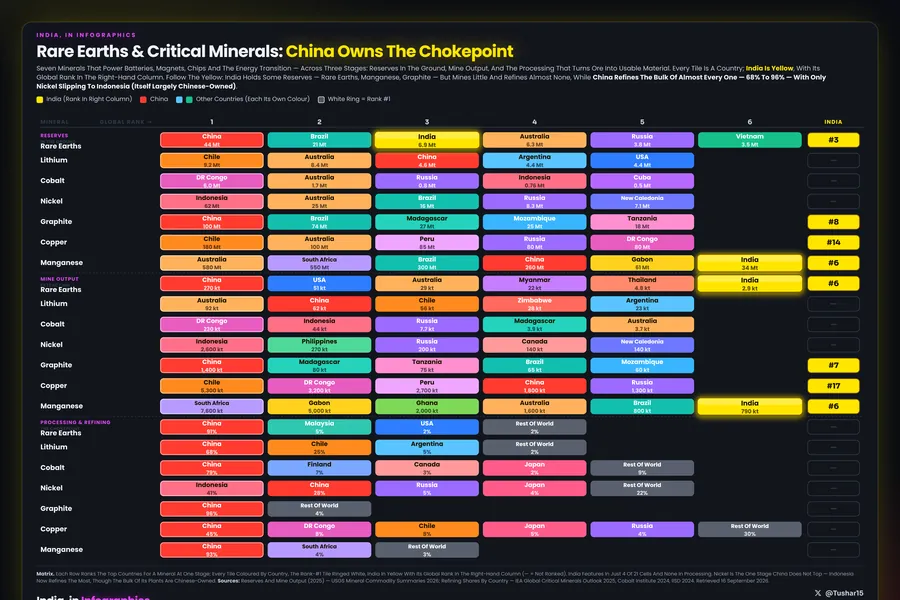
Solid-colour rank matrix of rare earths and six critical minerals across three stages — reserves, mine output and processing. Each tile is a country; India is yellow. India appears in only four of 21 cells (rare-earth and manganese reserves and output) and none in processing, where China leads every row, refining 70 to 96 percent of all seven minerals.
The Big Picture
Rare Earths & Critical Minerals: China Owns The Chokepoint
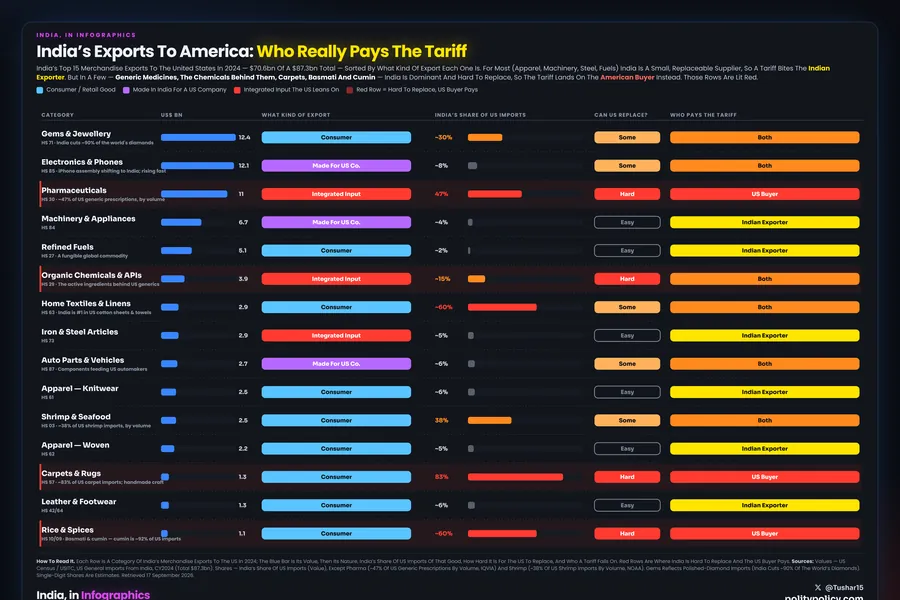
Ranked bar chart of India's top merchandise exports to the United States in 2024, coloured by who pays a tariff. Most is replaceable so the Indian exporter pays; but 61% by value across 36 categories is either America's own brands made in India or goods it cannot replace, where the US buyer pays. Generic medicines, carpets, cumin and guar gum have no substitute.
Trade & Geopolitics
Trump’s 100% Tariffs Tantrum: The Cost Will Be Paid By Americans, Eventually
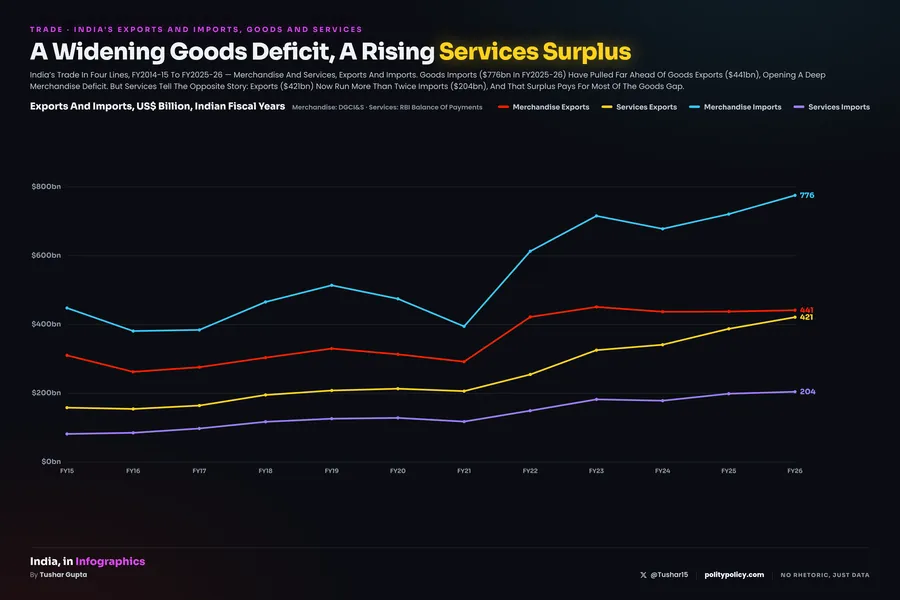
Four-line chart of India's trade, FY2014-15 to FY2025-26, US$ billion: merchandise exports (red), services exports (gold), merchandise imports (cyan) and services imports (violet). Merchandise imports rise highest to $776bn against $441bn of goods exports; services exports climb to $421bn, more than twice services imports at $204bn.
Trade & Exports
A Widening Goods Deficit, A Rising Services Surplus
PolityPolicy
by Tushar Gupta · No Rhetoric, Just Data
© 2026 PolityPolicy · by Tushar Gupta · Graphic free to share and reproduce with credit to politypolicy.com. Underlying data belongs to its original compilers.