India, in Infographics: Critical Minerals

Rare Earths & Critical Minerals: China Owns The Chokepoint

Seven Minerals Behind Batteries, Magnets And Chips, Across Three Stages — Reserves, Mine Output And Processing. Every Tile Is A Country; India Is Yellow, Its Rank In The Right-Hand Column. Hover Or Tap Any Country To Trace It Down The Ranks. The Story Is The Opposite Of Manufacturing: India Barely Appears — And China Tops The Processing Column In Six Of Seven; Only Nickel Goes To Indonesia (Largely Chinese-Owned).

Hover Or Tap Any Tile — Or A Chip — To Trace A Country Down The Ranks. India Stays Lit.
MINERALGLOBAL RANK →123456INDIARESERVESIN THE GROUNDRare EarthsChina44 MtBrazil21 MtAustralia6.3 MtRussia3.8 MtVietnam3.5 Mt#3LithiumChile9.2 MtAustralia8.4 MtChina4.6 MtArgentina4.4 MtUSA4.4 Mt—CobaltDR Congo6.0 MtAustralia1.7 MtRussia0.8 MtIndonesia0.76 MtCuba0.5 Mt—NickelIndonesia62 MtAustralia25 MtBrazil16 MtRussia8.3 MtNew Caledonia7.1 Mt—GraphiteChina100 MtBrazil74 MtMadagascar27 MtMozambique25 MtTanzania18 Mt#8CopperChile180 MtAustralia100 MtPeru85 MtRussia80 MtDR Congo80 Mt#14ManganeseAustralia580 MtSouth Africa550 MtBrazil300 MtChina260 MtGabon61 Mt#6MINE OUTPUTEXTRACTIONRare EarthsChina270 ktUSA51 ktAustralia29 ktMyanmar22 ktThailand4.8 kt#6LithiumAustralia92 ktChina62 ktChile56 ktZimbabwe28 ktArgentina23 kt—CobaltDR Congo230 ktIndonesia44 ktRussia7.7 ktMadagascar3.9 ktAustralia3.7 kt—NickelIndonesia2,600 ktPhilippines270 ktRussia200 ktCanada140 ktNew Caledonia140 kt—GraphiteChina1,400 ktMadagascar80 ktTanzania75 ktBrazil65 ktMozambique60 kt#7CopperChile5,300 ktDR Congo3,200 ktPeru2,700 ktChina1,800 ktRussia1,300 kt#17ManganeseSouth Africa7,600 ktGabon5,000 ktGhana2,000 ktAustralia1,600 ktBrazil800 kt#6PROCESSING & REFININGTHE CHOKEPOINTRare EarthsChina91%Malaysia5%USA2%Rest Of World2%—LithiumChina68%Chile25%Argentina5%Rest Of World2%—CobaltChina79%Finland7%Canada3%Japan2%Rest Of World9%—NickelIndonesia41%China28%Russia5%Japan4%Rest Of World22%—GraphiteChina96%Rest Of World4%—CopperChina45%DR Congo8%Chile8%Japan5%Russia4%Rest Of World30%—ManganeseChina93%South Africa4%Rest Of World3%—India6.9 MtIndia34 MtIndia2.9 ktIndia790 kt

Reserves And Mine Output (2025) From The USGS Mineral Commodity Summaries 2026; Processing Is Each Country’s Share Of World Refined / Separated Supply (IEA Global Critical Minerals Outlook 2025; Cobalt Institute 2024; IISD 2024). Every Tile Is A Country, The Rank-#1 Tile Ringed White; India Is Yellow, With Its Global Rank In The Right-Hand Column (— = Not Ranked / Negligible). Nickel Refining Now Leads From Indonesia, Most Of Its Capacity Chinese-Owned.

China’s Grip On Processing
6 Of 7
China Is The Top Refiner Of Six Of The Seven — 68% To 96% Of Rare Earths, Graphite, Manganese, Cobalt And Lithium. Only Nickel Goes To Indonesia.
India: Rare-Earth Reserves
#3
India Holds The World’s Third-Largest Rare-Earth Reserves — 6.9 Mt. Its One Bright Spot.
Cells Where India Ranks
4 Of 21
India Appears In Just Four Of 21 Cells — In Reserves And Mining. In Processing, None.
India’s Refining Share
~0%
India Processes Almost None Of These Minerals — Reserves In The Ground Are Not Power.
What The Matrix Says
Reserves Are Not Power; Processing Is. India Sits On A Real Rare-Earth Reserve (Third In The World), Some Manganese And Graphite — But It Mines Little Of Any Of Them, And Refines Almost Nothing. The Column That Decides Leverage Is The Last One, Processing, And It Is Mostly Red: China Refines 68% To 96% Of Rare Earths, Graphite, Manganese, Cobalt And Lithium, And 45% Of Copper — Often Ore It Does Not Even Mine. The One Exception Is Nickel, Where Indonesia Now Leads (~41% To China’s 28%) — Though The Bulk Of Its Refineries Are Chinese-Owned. For India, The Gap Is Not In The Ground; It Is In The Refinery.
Download The Graphic Post It How This Was Built ↓
Free To Use Anywhere With Credit To politypolicy.com

Reading The Matrix

How This Was Built

Reserves & Output
USGS Mineral Commodity Summaries 2026 (Data Year 2025), Per-Commodity World Mine Production And Reserves Tables. Reserves In Million Tonnes; Output In Thousand Tonnes Of Contained Metal, REO Or Graphite.
Processing Share
Each Country’s Share Of World Refined / Processed Supply — IEA Global Critical Minerals Outlook 2025, Cobalt Institute Market Report 2024, And IISD Commodity Profiles 2024. China Leads Six: Graphite 96%, Manganese 93%, Rare Earths 91%, Cobalt 79%, Lithium 68%, Copper 45%. Nickel Is Indonesia-Led (41% To China’s 28%), Its Capacity Largely Chinese-Owned.

Sources: USGS Mineral Commodity Summaries 2026 (Reserves & Mine Output, 2025); IEA Global Critical Minerals Outlook 2025 (Processing Share). Retrieved 16 September 2026.
Related Graphics

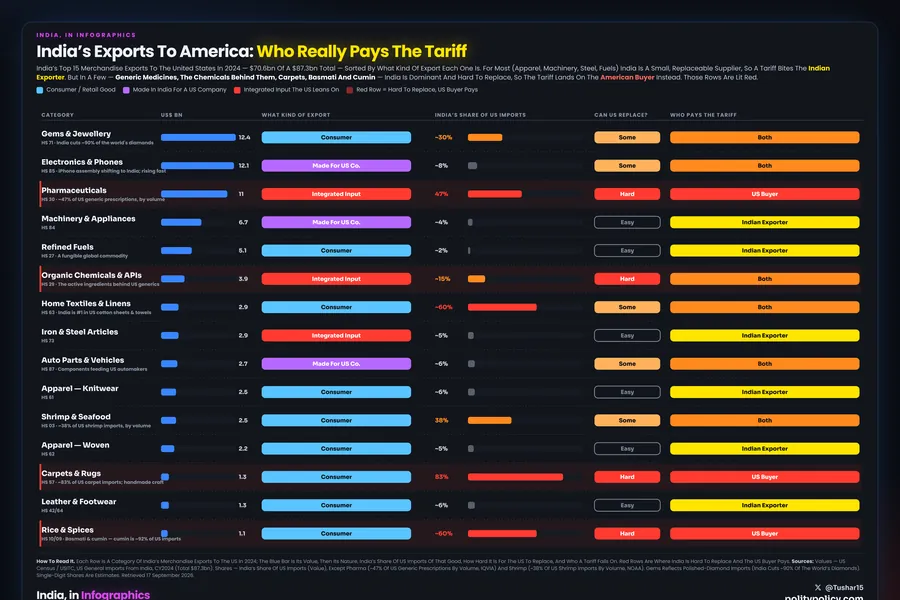
Ranked bar chart of India's top merchandise exports to the United States in 2024, coloured by who pays a tariff. Most is replaceable so the Indian exporter pays; but 61% by value across 36 categories is either America's own brands made in India or goods it cannot replace, where the US buyer pays. Generic medicines, carpets, cumin and guar gum have no substitute.
Trade & Geopolitics
Trump’s 100% Tariffs Tantrum: The Cost Will Be Paid By Americans, Eventually
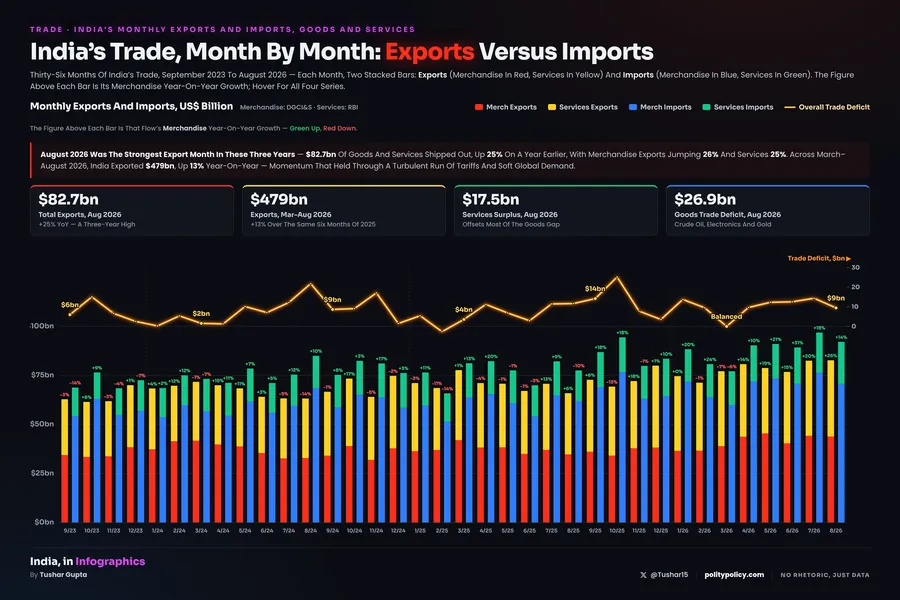
Grouped stacked bar chart of India's monthly trade, September 2023 to August 2026: each month two bars, exports (merchandise red, services yellow) and imports (merchandise blue, services green), US$ billion, with year-on-year growth above each bar. Import bars stay taller than export bars; by August 2026 exports reach about $82.7bn and imports about $92.1bn.
Trade
India's Trade, Month By Month: Exports Versus Imports
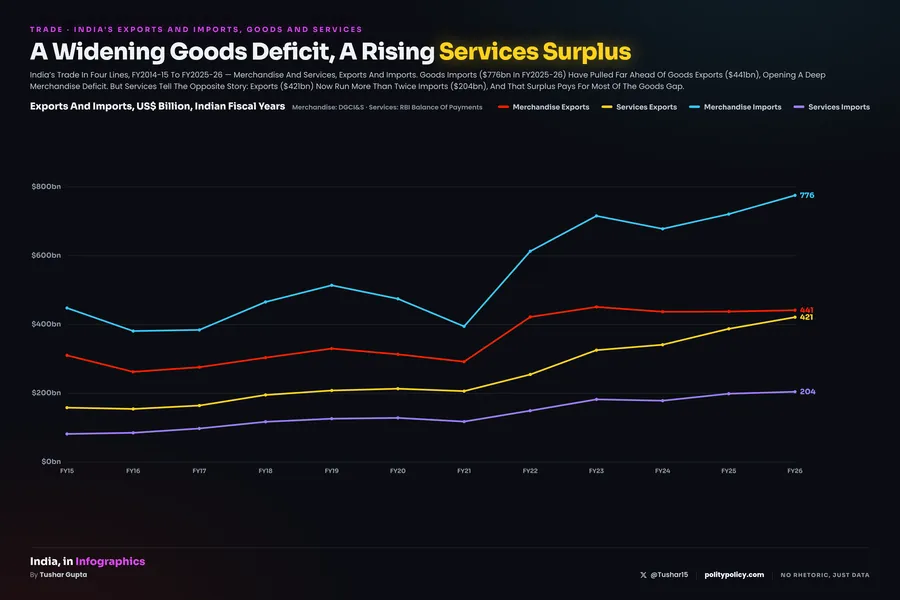
Four-line chart of India's trade, FY2014-15 to FY2025-26, US$ billion: merchandise exports (red), services exports (gold), merchandise imports (cyan) and services imports (violet). Merchandise imports rise highest to $776bn against $441bn of goods exports; services exports climb to $421bn, more than twice services imports at $204bn.
Trade & Exports
A Widening Goods Deficit, A Rising Services Surplus
PolityPolicy
by Tushar Gupta · No Rhetoric, Just Data
© 2026 PolityPolicy · by Tushar Gupta · Graphic free to share and reproduce with credit to politypolicy.com. Underlying data belongs to its original compilers.