India’s Inflation Has Doubled In 2026, And The RBI Is Raising Rates Again
Retail Inflation Rose From 2.74% In January To 5.54% In September, And On 7 October The RBI Raised The Repo Rate To 5.50%. Food Adds The Most; The Iran War Reached Shoppers Mainly Through Fuel And Transport.
Retail Inflation (CPI, Change On A Year Ago)RBI Repo RateRBI Tolerance Band, 2% To 6%
Swipe The Chart Sideways For Earlier Months ←
Hover Any Month For Inflation In Villages, Cities And All India, The Repo Rate, Crude Oil And Wholesale Fuel. Switch Between All India, Rural And Urban. The Gap At January 2026 Marks MoSPI’s New CPI Series.
Retail Inflation, Sep 2026
5.54%
Up From 2.74% In January
Food Prices, Sep 2026
7.74%
Consumer Food Price Index, From 5.97% In August
Transport Inflation, Sep 2026
5.01%
From Nil Before The May Fuel Price Rise
Repo Rate
5.50%
Raised 25 Basis Points On 7 Oct 2026
The Bottom Line
Inflation Doubled In 2026, From A Very Low Base. Most Of The Rise Came Through Food, Which Was Climbing Before The War And Met A Weak Monsoon. The Iran War’s Clearest Mark Is On Fuel: Wholesale Fuel Prices Ran 20% To 31% Above A Year Ago From April, And Retail Transport Inflation Went From Nil To 5.0% Once Pump Prices Rose In May. With Inflation Above Its 4% Target And Crude Back Above $110, The RBI Has Started Raising Rates.
Free To Use Anywhere With Credit To politypolicy.com
How The Iran War Reached Indian Prices
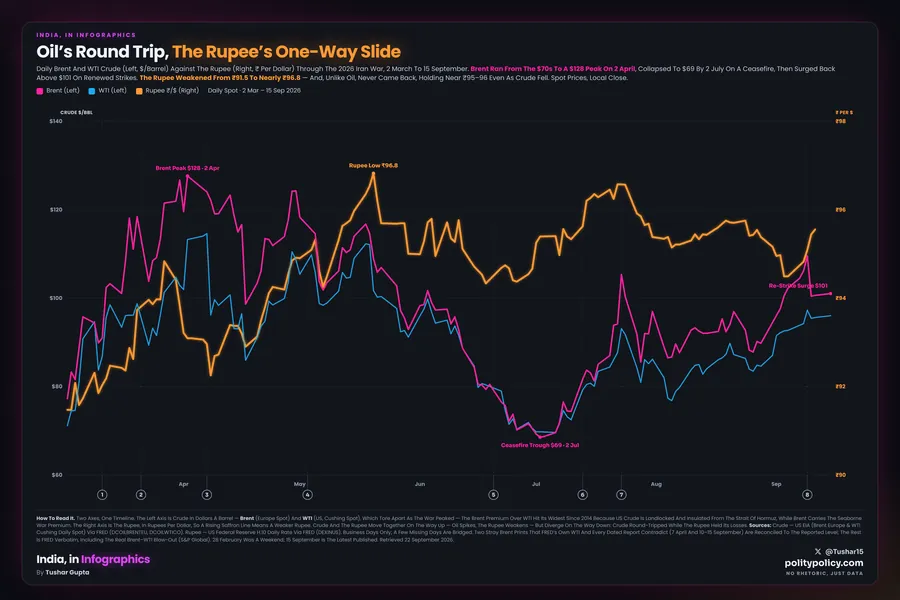
Three Steps, Same Months. Red Dashes: War Begins, 28 Feb. Orange Dashes: First Pump Price Rise, 15 May. Hover For Values.
1. Crude OilBrent, US$ Per Barrel, Monthly Average
2. Wholesale FuelWPI Fuel & Power, Change On A Year Ago
3. What Shoppers PayCPI Transport, Change On A Year Ago
What’s Pushing Inflation Up, 2026
Food & DrinksTransportHousing, Power & FuelRestaurants & HotelsPersonal Care (Incl. Gold)Everything Else
Hover Any Month For Each Group’s Contribution In Percentage Points, And Its Own Inflation Rate. The Labels On Top Are MoSPI’s Published Rate; The Stacks Add Up To It Within 0.01 Points.
What The Data Shows
Inflation Has Doubled Since January
Retail Inflation Rose From 2.74% In January To 5.54% In September, And Has Climbed In Every Month Since February. It Started From A Very Low Base: Inflation Bottomed At 0.25% In October 2025. It Is Now Above The RBI’s 4% Target, Though Still Inside The 2% To 6% Band. Villages Feel It More: 6.08% Rural Against 4.88% Urban.
Food Adds The Most
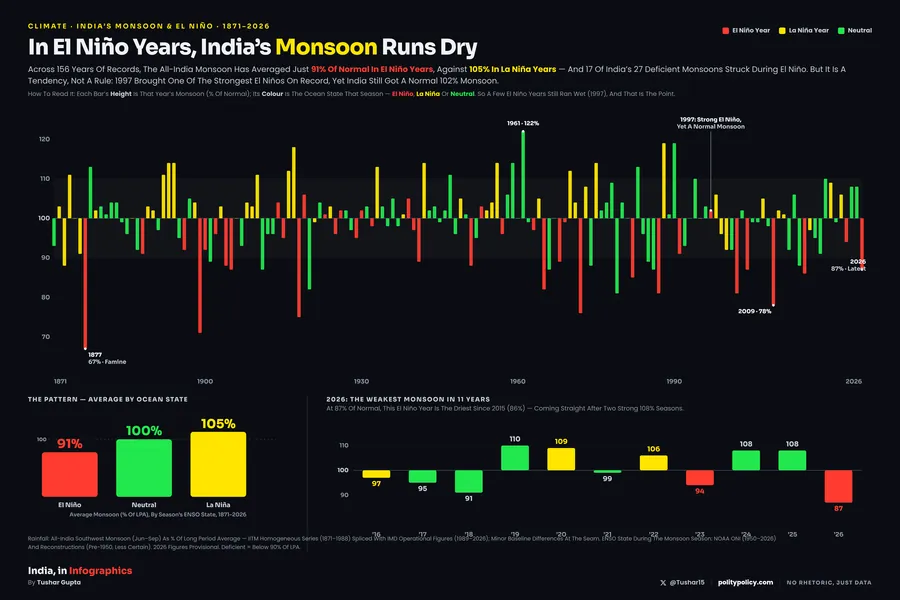
Food And Drinks Contributed 2.71 Points Of September’s 5.54%, Almost Half. Between February And September, Food’s Contribution Rose 1.49 Points, About Three Quarters Of The 2.33-Point Rise In Inflation. Food Inflation Jumped From 5.97% In August To 7.74% In September (Consumer Food Price Index). The 2026 Monsoon Delivered 87% Of Normal Rainfall, The Weakest In 11 Years (Provisional IMD Data). Food Prices Were Already Rising Before The War, From January.
Where The War Shows Up: Fuel And Transport
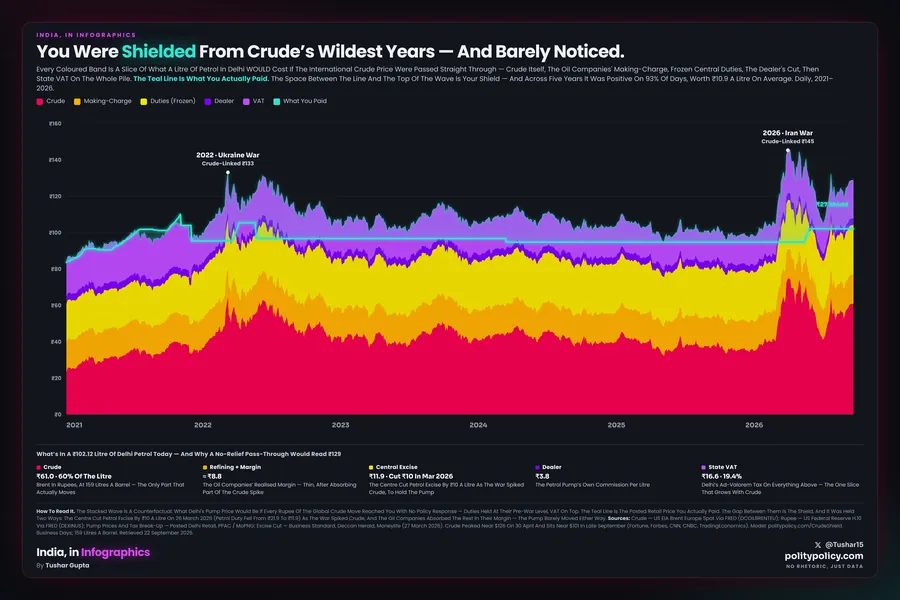
Brent Crude Averaged $71 A Barrel In February And $117 In April, After The War Began On 28 February. Wholesale Fuel And Power Prices Went From -3.4% To +25.0% On A Year Ago In Two Months, Peaking At +30.8% In May. Pump Prices, Frozen For About Four Years, Rose In Four Steps Between 15 And 25 May: Delhi Petrol Went From ₹94.77 To ₹102.12 And Diesel From ₹87.67 To ₹95.20. Retail Transport Inflation Was Nil Until April, Then 1.75% In May And 5.01% In September. Its Contribution Rose From Nil To 0.43 Points. Brent Was Back At $114 In September.
Eating Out Is Rising Faster
Restaurant And Hotel Prices Rose 9.36% In September, Up From 2.87% In January, The Fastest Climb Of Any Group. Their Contribution Rose From 0.10 To 0.32 Points. These Data Do Not Show Why: Food, Fuel And Wages All Feed Into Menu Prices.
Gold Is Not Behind The Rise
Personal Care, Which Includes Gold Jewellery, Is Still Up 13.75%, But That Is Down From 19.06% In January. Its Contribution Fell From 1.02 To 0.74 Points Since February, Pulling Inflation Down, Not Up.
The RBI Turns
The RBI Cut The Repo Rate Four Times In 2025, From 6.50% To 5.25%, When Inflation Was Falling. On 7 October 2026 It Raised The Rate To 5.50%, Its First Hike Since February 2023, And Projects Inflation Of 5.2% For 2026-27, With 6.0% In October To December.
Sources & Method
Retail Inflation
MoSPI All-India Consumer Price Index, Change On A Year Ago, Via The PolityPolicy Pulse CPI Tracker. From January 2026 MoSPI Publishes A New Series (Base 2024=100, 12 Spending Groups); Earlier Months Use The 2012 Series. The Two Are Not Strictly Comparable, So The Chart Shows A Gap.
Contributions
Each Group’s Weight (MoSPI’s All-India Weights For The New Series) Times Its Index Change Over 12 Months, Divided By The Headline Index A Year Earlier. The Weights Rebuild MoSPI’s Headline Index To Within 0.01 Points In Every Month, And The Contributions Add Up To The Published Rate. A Contribution Shows Where Inflation Sits, Not What Caused It.
Fuel And Crude
Wholesale Fuel & Power: DPIIT Wholesale Price Index, Base 2022-23, July And August Provisional; September Is Due On 14 October. Brent: US Energy Information Administration Monthly Average, Via FRED. Pump Prices: Oil Marketing Companies’ Revisions Of 15, 19, 23 And 25 May 2026, Delhi; Unchanged Through September.
Event Dates: War Began 28 February 2026; Petrol And Diesel Raised Four Times From 15 To 25 May 2026 (Delhi Petrol ₹94.77 To ₹102.12, Diesel ₹87.67 To ₹95.20); RBI Repo Rate Raised To 5.50% On 7 October 2026. Monsoon: IMD, Provisional, See Our Monsoon And El Niño Graphic. Monthly Series Also On politypolicy.com/pulse/CPI And politypolicy.com/pulse/WPI.