Security & The State

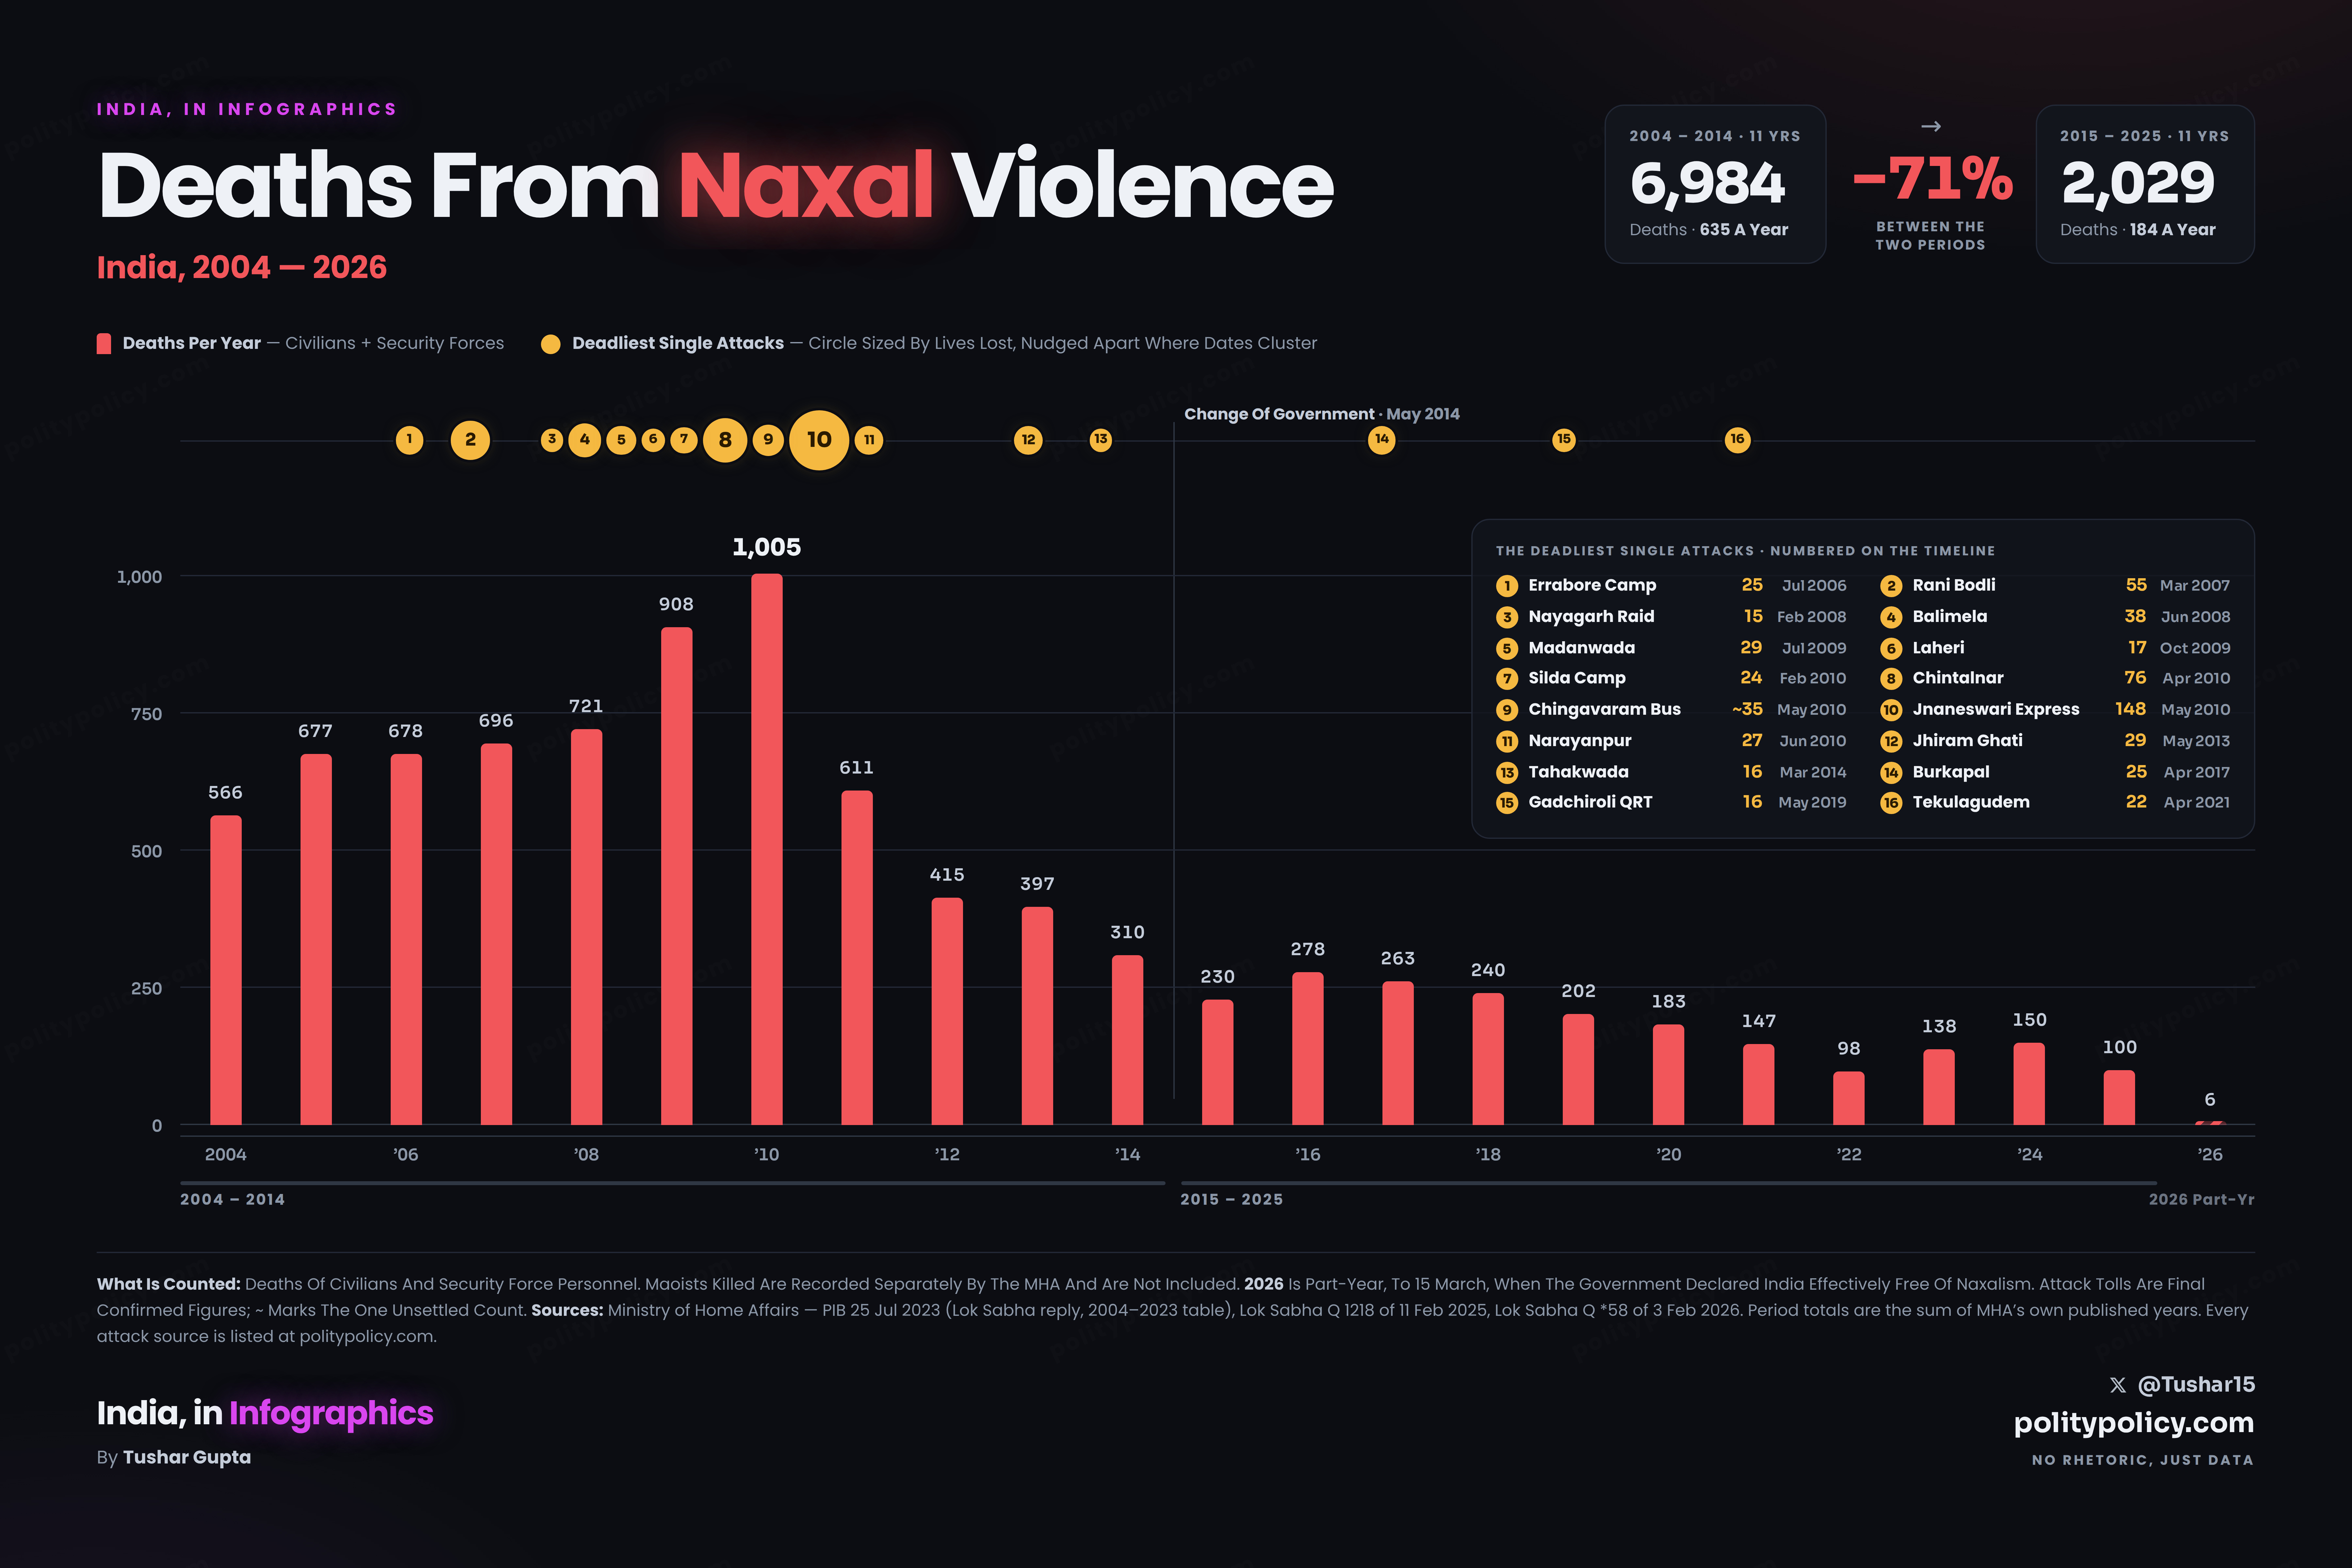
Deaths From Naxal Violence 2004–2026

By Tushar Gupta · · Source: Ministry of Home Affairs
6,984
2004–2014
→
2,029
2015–2025
−71%
Between the two
Deaths per year — civilians + security forces Deadliest single attacks — circle sized by lives lost
Swipe The Chart →
0 250 500 750 1,000 Change of government · May 2014 566 2004 677 678 ’06 696 721 ’08 908 1,005 ’10 611 415 ’12 397 310 ’14 230 278 ’16 263 240 ’18 202 183 ’20 147 98 ’22 138 150 ’24 100 6 2026 Rani Bodli55 killed · 2007 Balimela reservoir38 killed · 2008 Jnaneswari Express148 killed · 2010 Jhiram Ghati29 killed · 2013 Burkapal25 killed · 2017 Tekulagudem22 killed · 2021
Counted: civilians and security force personnel. Maoists killed are recorded separately by the MHA and are not included. 2026 is part-year, to 15 March. Period totals are the sum of MHA’s own published years.
Download Post It
Free to use anywhere with credit to politypolicy.com

Related Graphics

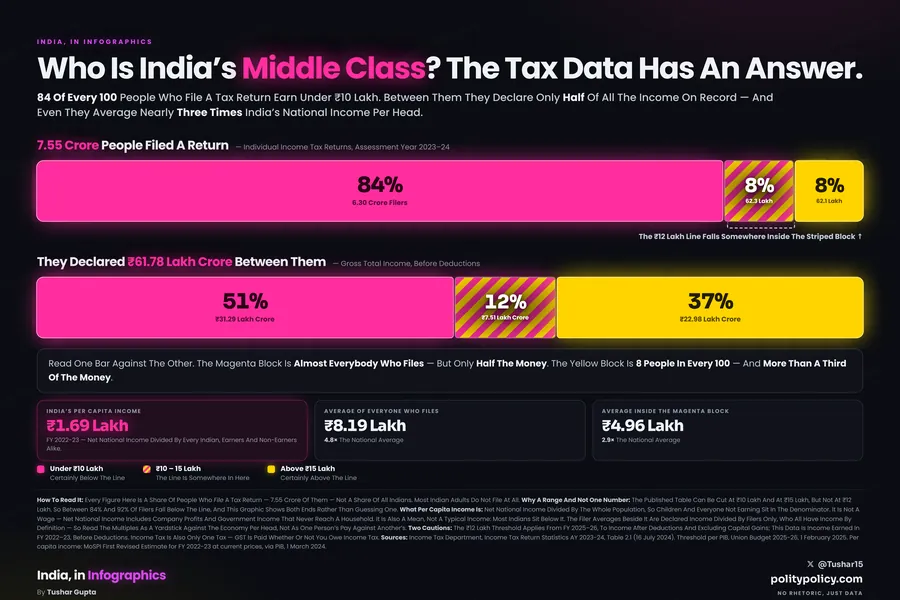
Two bars comparing India's tax filers with the income they declared, AY 2023-24: 84% of filers earn under Rs 10 lakh but declare only 51% of the income, while 8% earn above Rs 15 lakh and declare 37%. India's per capita income that year was Rs 1.69 lakh
Money & The State
Who Is India’s Middle Class?
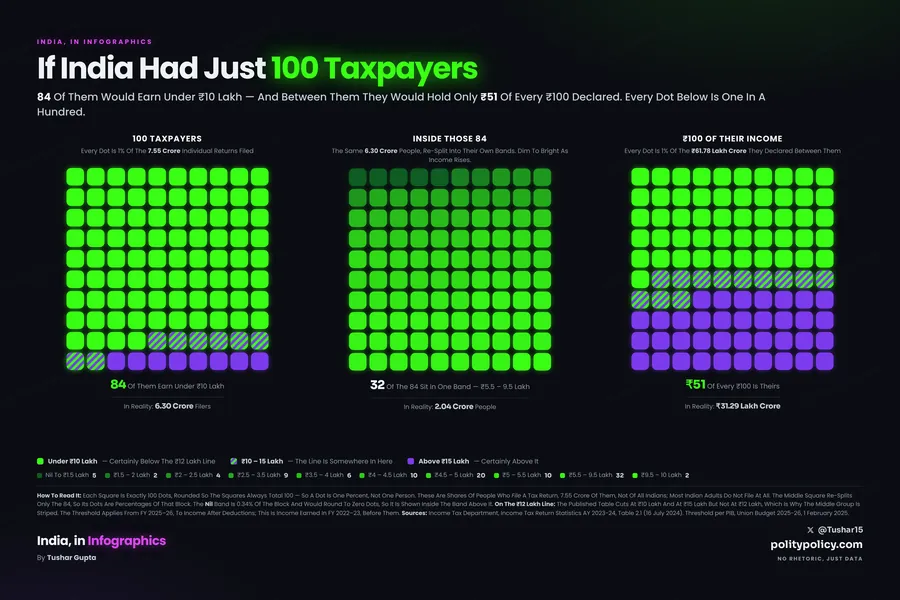
Three grids of 100 dots each: 84 of 100 Indian taxpayers earn under Rs 10 lakh, those 84 broken into their own income bands with 32 in the Rs 5.5 to 9.5 lakh band, and Rs 51 of every Rs 100 declared belonging to those 84
Money & The State
If India Had Just 100 Taxpayers
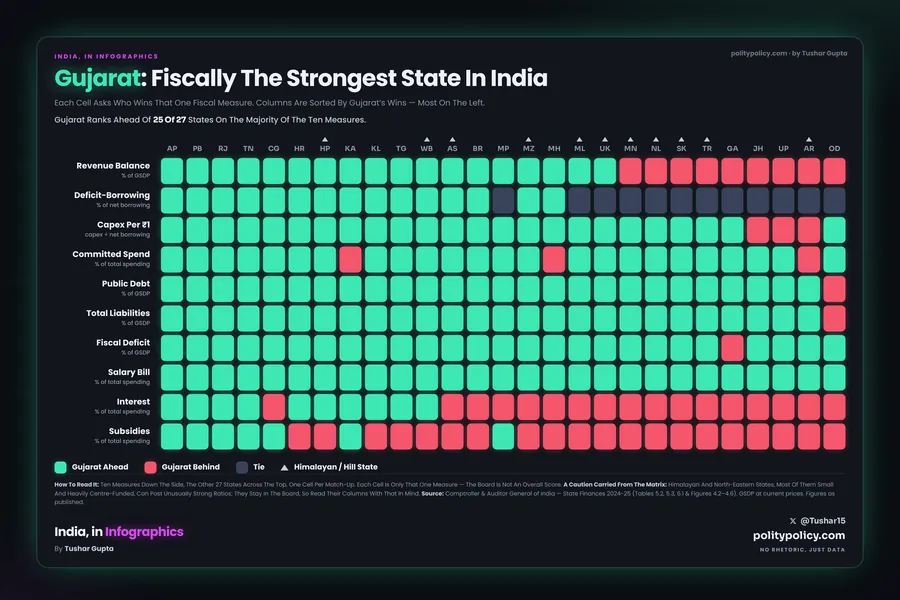
Gujarat on the State Finances Matrix, CAG 2024-25: a grid of ten fiscal measures against the other 27 states, one cell per match-up — almost every cell is green, and Gujarat ranks ahead of 25 of 27 states
Money & The State
Gujarat: Fiscally The Strongest State In India
PolityPolicy
by Tushar Gupta · No Rhetoric, Just Data
© 2026 PolityPolicy · by Tushar Gupta · Graphic free to share and reproduce with credit to politypolicy.com. Underlying data belongs to its cited source.