India, in Infographics: The Big Picture

India — The Third-Largest Economy In The Making.

India Passed Japan In 2025 To Become The World’s Fourth-Largest Economy; Germany, And Third Place, Is Next. Under That Rise Sits A Manufacturing Base That Ranks #1 Or #2 In 13 Of 19 Major Industries. Every Tile Is A Country; India Glows Yellow. Hover Or Tap Any Country To Trace It Across The Ranks — The Story Is Plain: India Is Almost Always Second, Usually To China.

Hover Or Tap Any Tile — Or A Chip — To Trace A Country Down The Ranks. India Stays Lit.
INDUSTRYRANK →1234567METALS & BUILDINGCrude SteelChina960.8 MtUSA82.0 MtJapan80.7 MtRussia67.8 MtCementChina1,700 MtVietnam100 MtTürkiye89 MtUSA84 MtCeramic TilesChina39.5%Brazil5.5%Vietnam3.4%Iran3.0%AluminiumChina45 MtRussia3.9 MtCanada3.3 MtUAE2.7 MtZincChina4.1 MtPeru1.5 MtAustralia1.1 MtMexico0.8 MtCHEMICALS & FERTILISERSChemical SalesChina46%USA12%Germany4%Japan3%S. Korea3%AmmoniaChina49 MtRussia15 MtUSA14 MtIndonesia6 MtCLEAN ENERGYBiofuel ShareUSA37%Brazil22%Indonesia10%China4%Solar PV ModulesChina86.5%USA3.2%Vietnam2.5%Thailand1.5%ELECTRONICSMobile PhonesChina1.67 bnOIL REFININGRefinery ThroughputUSA16.4m bpdChina14.7m bpdRussia4.9m bpdS. Korea2.8m bpdAUTOSPassenger CarsChina29.4mUSA7.3mJapan7.2mGermany4.0mTwo-WheelersIndonesia6–7mVietnam3–3.5mTrucksChina1,256kUSA295.4kJapan140.6kBrazil125.2kBusesChina118.4kUSA31.9kBrazil28.7kTürkiye17.6kJEWELLERYDiamond PolishingLab-Grown DiamondsChina45%USA10%INFRASTRUCTUREContainer PortsChina299.7mUSA59.7mSingapore41.1mS. Korea31.9mMalaysia30.7mVietnam24.4mShip RecyclingBangladesh32%Türkiye12%China10%Pakistan6%India164.9 MtIndia470 MtIndia16.1%India4.2 MtIndia0.9 MtIndia3%India15 MtIndia5%India3.3%India325–330 mIndia5.5m bpdIndia5.3m★India & ChinaJoint #1India401.9kIndia112.8k★India~90%India35%India23.9m★India35%

Rank By Output Or Capacity, Latest Available Year; The Rank-#1 Tile Is Ringed White, India’s Genuine #1s Carry A Star. Steel Figures Are Worldsteel 2025; Others Compiled From Public Industry Data. Economy Rank: IMF (India 4th, 2025).

India’s Economy Rank
4th → 3rd
Fourth-Largest In 2025 (Past Japan); Germany And Third Place Are Next.
Industries #1 Or #2
13 Of 19
From Steel And Cement To Phones And Solar — India Ranks Top-Two In Most.
Industries India Leads
3
Diamond Polishing, Two-Wheelers (Joint With China) And Ship Recycling.
Of China’s Steel
~1/6th
Even At #2, India’s Steel Output Is A Sixth Of China’s — The Pattern Repeats.
What The Matrix Says
India Is A Top-Two Manufacturer Almost Everywhere That Matters — And A Distant Second Almost Everywhere Too. The Yellow Spine Runs Down Column Two, Breaking Rank Only Where India Genuinely Leads: Older, Labour-Deep Trades. In The Capital-Heavy Sectors That Define Industrial Power — Steel, Cement, Electronics, Solar — India Is Firmly Second, And Second Means A Fraction Of China. That Gap Is The Room Still To Grow.
Download The Graphic Post It How This Was Built ↓
Free To Use Anywhere With Credit To politypolicy.com

Reading The Matrix

How This Was Built

The Ranking
Each Industry’s Top Producers By Output Or Capacity, Ranked 1–7, Latest Available Year. Every Tile Is Coloured By Country; India Is Yellow And Lifted, The #1 Tile Ringed White.
Sources & Caveats
Steel Is Worldsteel 2025 (China 960.8 Mt, India 164.9 Mt); Other Rows Are Compiled From Public Industry Data. Two-Wheelers Are A China–India Tie. Economy Rank From The IMF.

Sources: worldsteel; IMF; Public Industry Data. Retrieved 10 September 2026.
Related Graphics

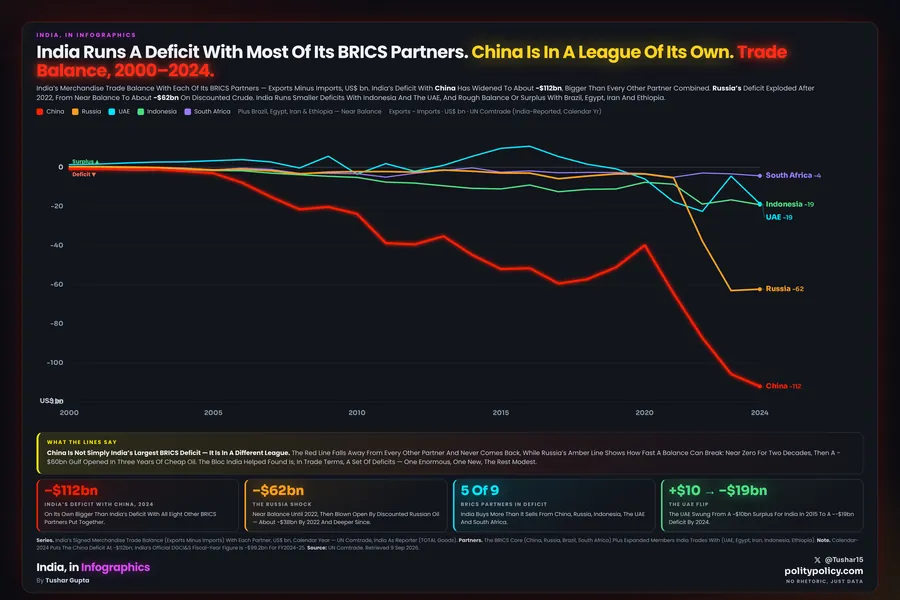
Line chart of India's signed merchandise trade balance with its BRICS partners, 2000 to 2024, US dollars billion. China falls alone to about minus 112 billion; Russia dives after 2022 to about minus 62 billion on discounted oil; the UAE and Indonesia sit near minus 19 billion; Brazil, Egypt, Iran and Ethiopia stay near balance. India runs a deficit with five of nine.
Trade & Geopolitics
China Towers Over India’s BRICS Deficits
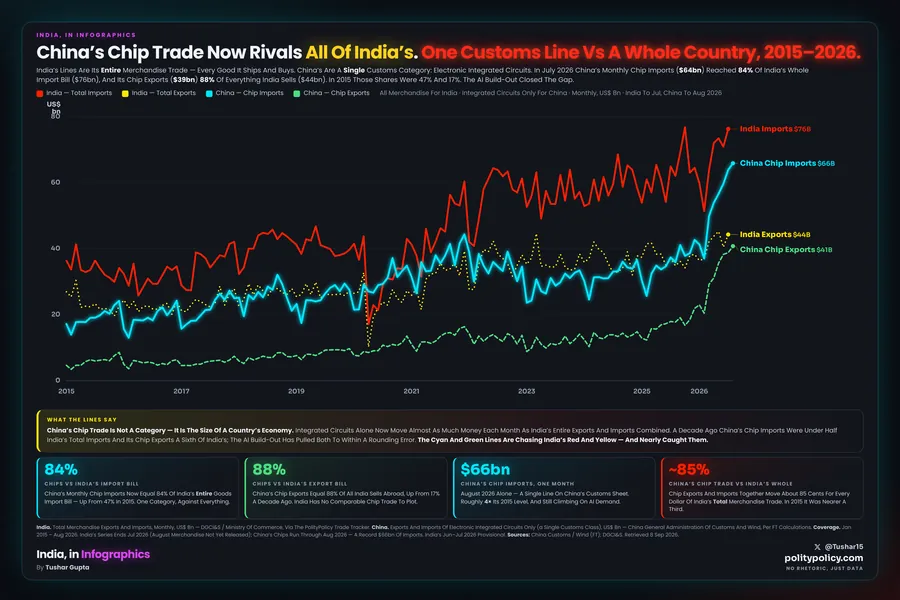
Four monthly lines in US dollars billion, January 2015 to July 2026. India in red (total merchandise imports, ending about $76bn) and yellow (total exports, about $44bn); China in cyan (chip imports, climbing to about $64bn) and green (chip exports, about $39bn). The two Chinese chip-only lines rise from the floor to nearly meet India's entire-trade lines.
Trade & Technology
China’s Chip Trade Now Rivals All Of India’s
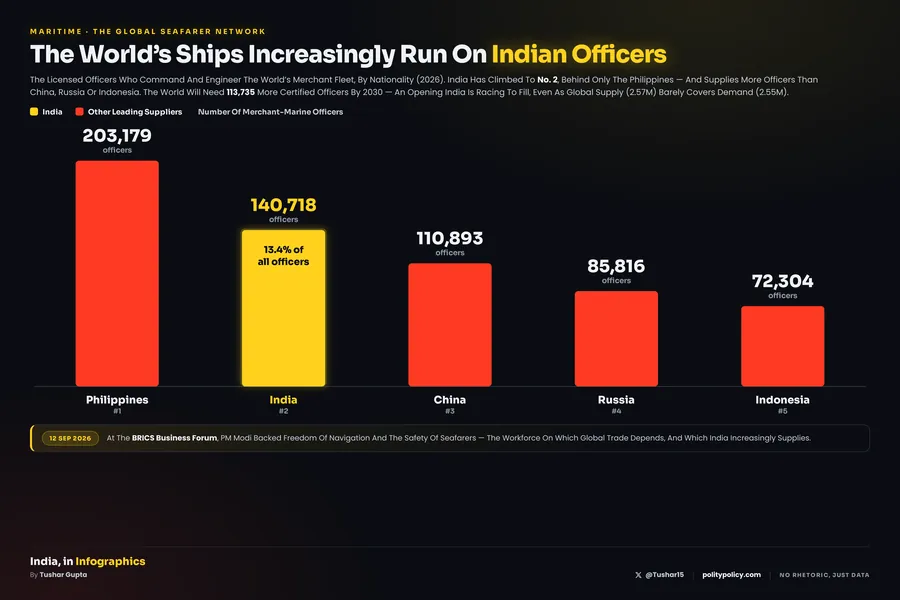
Bar chart of merchant-marine officers by nationality in 2026: Philippines 203,179, India 140,718 (highlighted, 13.4% of the world's officers), China 110,893, Russia 85,816, Indonesia 72,304. India ranks second, up from fifth a decade ago, with the fleet facing a 113,735-officer shortfall by 2030.
Maritime & Trade
The World’s Ships Increasingly Run On Indian Officers
PolityPolicy
by Tushar Gupta · No Rhetoric, Just Data
© 2026 PolityPolicy · by Tushar Gupta · Graphic free to share and reproduce with credit to politypolicy.com. Underlying data belongs to its original compilers.