India, in Infographics: Trade & Exports
India’s Exports Hit $863 Billion — And Services Have Almost Caught Goods
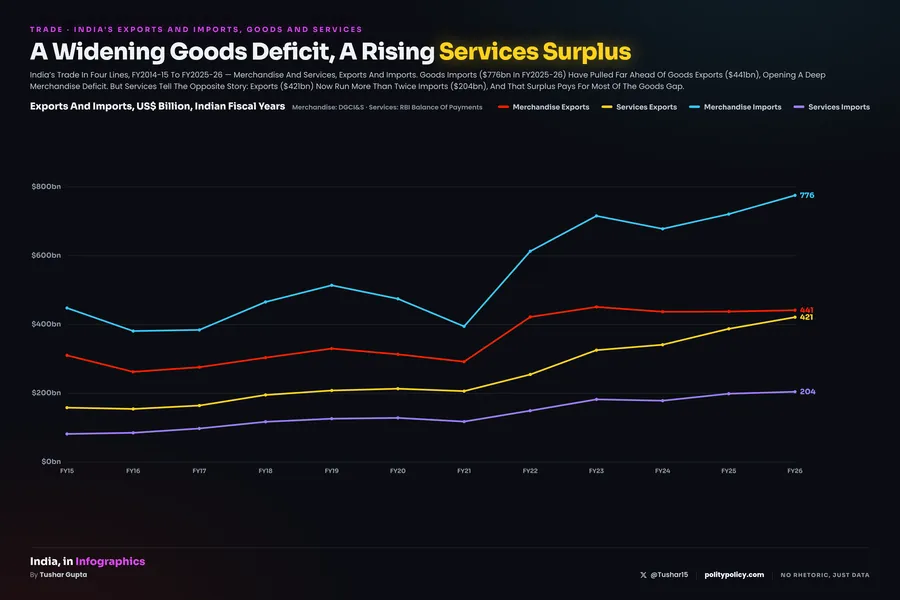
India Exported $863 Billion Of Goods And Services In FY2025-26, Nearly Seven Times The $127 Billion Of Two Decades Ago. Merchandise Still Leads At $441 Billion — But Services Have Grown Almost Tenfold To $421 Billion, Climbing From Barely Half Of Goods In FY2004-05 To 95% Today.
Top: India’s Annual Exports Of Merchandise (DGCI&S Customs) And Services (RBI Balance Of Payments), FY2004-05 To FY2025-26 — Toggle Between Both, Merchandise And Services. Bottom: The 30 Largest Merchandise Export Commodities By Value In FY2025-26 (HS-2 Chapters), Which Together Are 87% Of All Goods Exports. Sources: DGCI&S; RBI; Ministry Of Commerce.
Total Exports, FY2025-26
$863bn
Goods Plus Services — A Record, And Nearly 7x The FY2004-05 Level.
Services Exports
$421bn
Up Almost Tenfold In Two Decades; Now 49% Of Everything India Exports.
Merchandise Exports
$441bn
Goods Still Lead — But Services Are Closing The Gap Fast.
Services As A Share Of Goods
95%
Up From 52% In FY2004-05 — Services Have Almost Caught Merchandise.
What The Numbers Say
Services Are Becoming India’s Export Engine. For Two Decades Goods And Services Rose Together, But Services Rose Faster — Nearly Tenfold Against Goods’ Fivefold — And The Gap Between Them Has Narrowed From More Than Two-To-One To Almost Level. India Sells The World Software, Back-Office And Professional Work As Readily As It Sells Goods, And That Trade Runs A Large Surplus Where Merchandise Runs A Deficit. If The Present Pace Holds, Services Will Be India’s Single Largest Export Before The Decade Is Out.
Goods, Services, And The Crossover
Goods · $84bn → $441bn
Merchandise Exports Rose More Than Fivefold, But In Fits And Starts — A Plateau Around $300bn Through The 2010s, A Dip To $262bn In FY2015-16, Then A Surge Past $400bn After FY2021-22.
Services · $43bn → $421bn
Services Grew Almost Tenfold And Far More Steadily — Software, Business, Professional And Financial Services Compounding Year After Year, Barely Pausing Even Through The Pandemic.
The Crossover · 52% → 95%
In FY2004-05 India Earned About Half As Much From Services As From Goods. Today It Earns 95 Cents Of Services For Every Dollar Of Goods — And Services Are Already A Larger Net Earner.
How This Was Built
Merchandise
DGCI&S Customs Exports, Indian Fiscal Years, US$ Billion. FY2016-17 To FY2025-26 Are Verified To The Dollar Against The DGCI&S Export-Import Data Bank; FY2004-05 To FY2015-16 Are DGCI&S Customs Annual Figures (Economic Survey / Department Of Commerce).
Services
RBI Balance-Of-Payments Services Credit, Indian Fiscal Years. FY2021-22 To FY2025-26 Are The Ministry Of Commerce / PIB Figures; Earlier Years Are RBI BoP Services Credit, Corroborated By World Bank Data. Merchandise Plus Services Reproduces The Official PIB Total Exports For FY2023-24 ($778bn), FY2024-25 ($825bn) And FY2025-26 (~$863bn).
Sources: DGCI&S Export-Import Data Bank (Merchandise); RBI Balance Of Payments (Services); Ministry Of Commerce / PIB (Combined Totals). Retrieved 15 September 2026.